The mobile phone has rapidly become a very essential tool, that we carry with us all the time, everywhere we go. It has become the focus of our communication and information in a hyper-connected world, which tolerates less and less that we disconnect or just don't have immediate access to information.
Based on this conclusion the City of Geneva decided to take the challenge to visualize these digital traces created by our mobile phones. The objective of this installation is to make this data visible and allow you to explore these streams of connected people around the city, in their everyday life.
Animation
Posters
-
 Explore Visualization
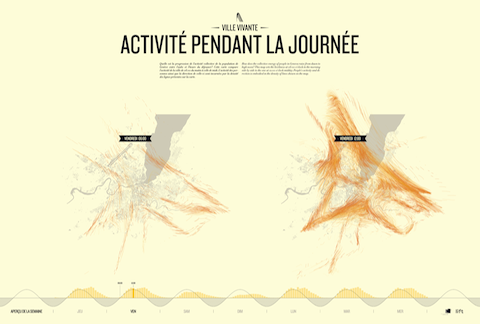
Activity during the day
How does the collective energy of people in Geneva raise from dawn to high noon? This map sets the liveliness at 06:00 o'clock in the morning side by side to the one at 12:00 o'clock midday. People's activity and direction is embodied in the density of lines shown on the map.
-
 Explore Visualization
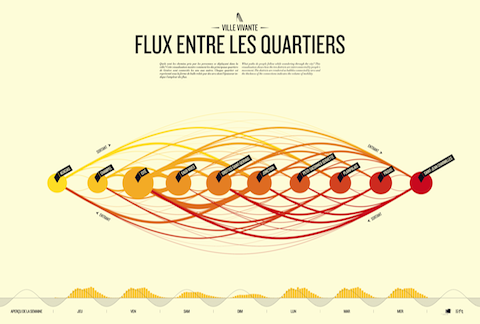
Streams between different city districts
What paths do people follow while wandering through the city? This visualization shows how the ten districts are interconnected by people's movement. The districts are rendered as bubbles connected by arcs and the thickness of the connections indicates the volume of mobility.
-
 Explore Visualization
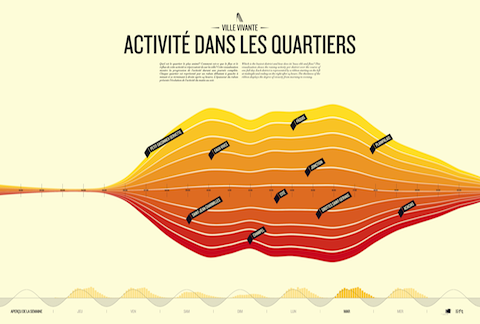
Activity in the city districts
Which is the busiest district and how does its' buzz ebb and flow? This visualization shows the raising activity per district over the course of one full day. Each district is represented by a ribbon starting on the left at midnight and ending on the right after 24 hours. The thickness of the ribbon displays the degree of vivacity from morning to evening.
-
 Explore Visualization
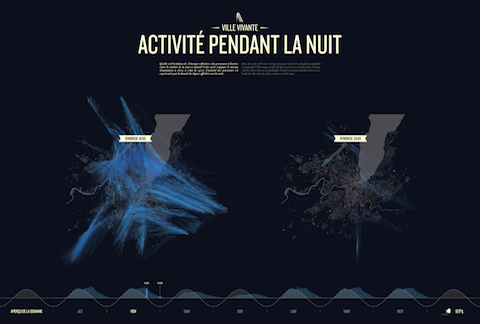
Activity during the night
How does the collective energy of people in Geneva dip from nightfall to midnight? This map sets the liveliness at 18:00 o'clock in the evening side by side to the one at midnight. People's activity and direction is embodied in the density of lines shown on the map.
-
 Explore Visualization
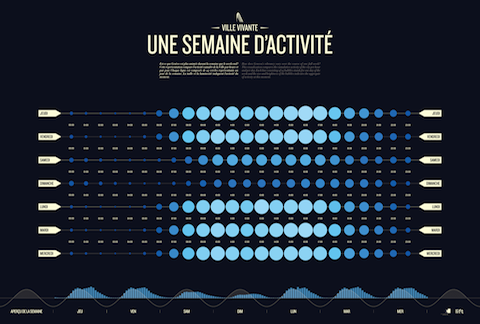
A week of activity
How does Geneva's vibrancy vary over the course of one full week? This visualization compares the cumulative activity of the city per hour and per day. Each line consisting of 24 bubbles stands for one day of the week and the size and brightness of the bubbles indicates the aggregate of activity at this moment.
-
 Explore Visualization
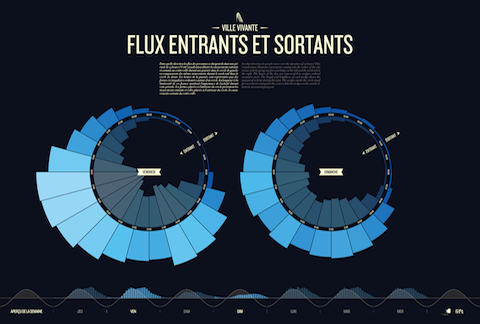
Incoming and outgoing streams
In what direction do people move over the duration of 24 hours? This visualization illustrates movements coming into the center of the city versus activity going out, for a weekday on the left and the weekend on the right. The hours of the day are represented as wedges ordered around a circle.
Background
Almost 1.6 billion mobile phones have been sold worldwide in 2010, 19% of them being smartphones. In 2010, the number of mobile subscriptions has reached almost 10 million in Switzerland, which is more than the number of people living in the country. Approximately 25% of these telephones featured a broadband internet connection.
Every mobile phone leaves digital traces permanently, while interacting with the mobile infrastructure. It can be seen as a mobile sensor that allows to define the geographic position of the subscription holder, almost in real-time.
During one day Swisscom subscribers in Geneva generate approximately 15 million connections from 2 million phone calls. This information called 'digital traces' offers new insights about the city, which are of great interest both from a economic and political perspective. Examples are the following.
- For citizens this data allows to feel the pulse of the population and see how they use the urban space. It offers a great innovation opportunity for new citizen services like traffic jam detectors or nightlife buzz indicators.
- For the public administration these digital traces can be very useful to evaluate urban planning strategies.
- For businesses the digital traces can reveal insights on how popular certain districts are, during what time periods. This information can be leveraged to determine leases or chose the best spot for a shop or restaurant.
More generally digital traces allow to reveal information that is invisible in traditional visualization techniques such as cartography. They reflect mobility in a city or a street and therefore represent 'living' space, animated by the people.
Press
Press Kit
The video and high-resolution images can be downloaded to be used in publications.
Copyright
The above material can be used free of copyright provided that the project is duly credited, as it appears on this website and the city of Geneva receives a digital copy (PDF) of the publication before printing, and the final version afterwards.
Contact
For press inquiries, please get in touch with:
Ville de Genève
Raoul Schrumpf
+41 (0)22 418 24 68
raoul.schrumpf(put an @ here)ville-ge.ch
A project by the City of Geneva
![]()
In collaboration with Lift
![]()
Realized by Interactive Things
![]()
Anonymized mobile data by Swisscom
Data processing and analysis by Near Future Lab